Mark Distance Range (Quick View and Planar View)
|
1238888 |
The scan points in the quick view and the planar view are normally displayed so that the reflection value of a scan point determines the brightness of the pixel. You can also display the scan points so that the pixel assumes a different color depending on the distance of the scan point from the scanner. You can also then choose to either have all scan points in a range assume the same color or have the color reflect the actual distance.
This type of visualization is appropriate, for example, when analyzing a scan, if it must not fall below a certain level of precision. Generally, the quality of a scanner's distance measurement is not constant across the entire range but decreases as the distance increases. You can then highlight in color the range in which the distance measurement is no longer satisfactory.
You can switch the highlighting on or off using the Mark Range on/off button  in the toolbar.
The colors are displayed corresponding to your entries:
-
Scan points that lie close to the lower limit is colored red.
-
Scan points that lie in between are colored yellow to green.
-
Scan points that lie close to the upper limit is colored blue.
-
Scan points lying outside this range are not colored.
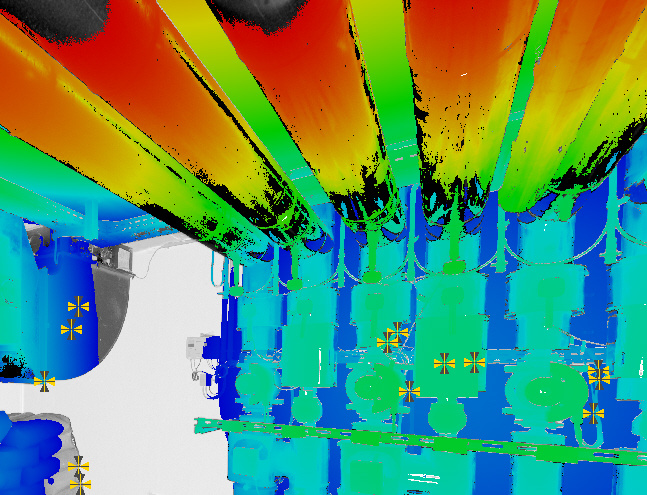
Figure 10-18 Scan points colored depending on distance
You can edit layers, objects and ranges in the Visibility Settings dialog. To open this dialog:
-
Right-click in the planar view.
-
Select Visibility Settings from the context menu.