Registration Report
|
1238888 |
After you have gone through all registration steps, the Registration Report will give you an overview of the results.
In the Registration Dashboard, click the Registration Report button. This button is also displayed on the final page of the registration task.
For the report, all values with a length unit (point error, subsampling settings, and others) will be shown in the smallest unit of the selected set (metric = mm, imperial = inch, imperial US = inch US).
Target Statistics
Target Statistics shows all reference pairs and target pairs used for the scan registration. Values close to zero indicate a good registration result. Here you can easily identify reference pairs which are causing problems in the registration.
As you can see in the figure below, all values are color coded with a bar on the left side, same as the table cells.
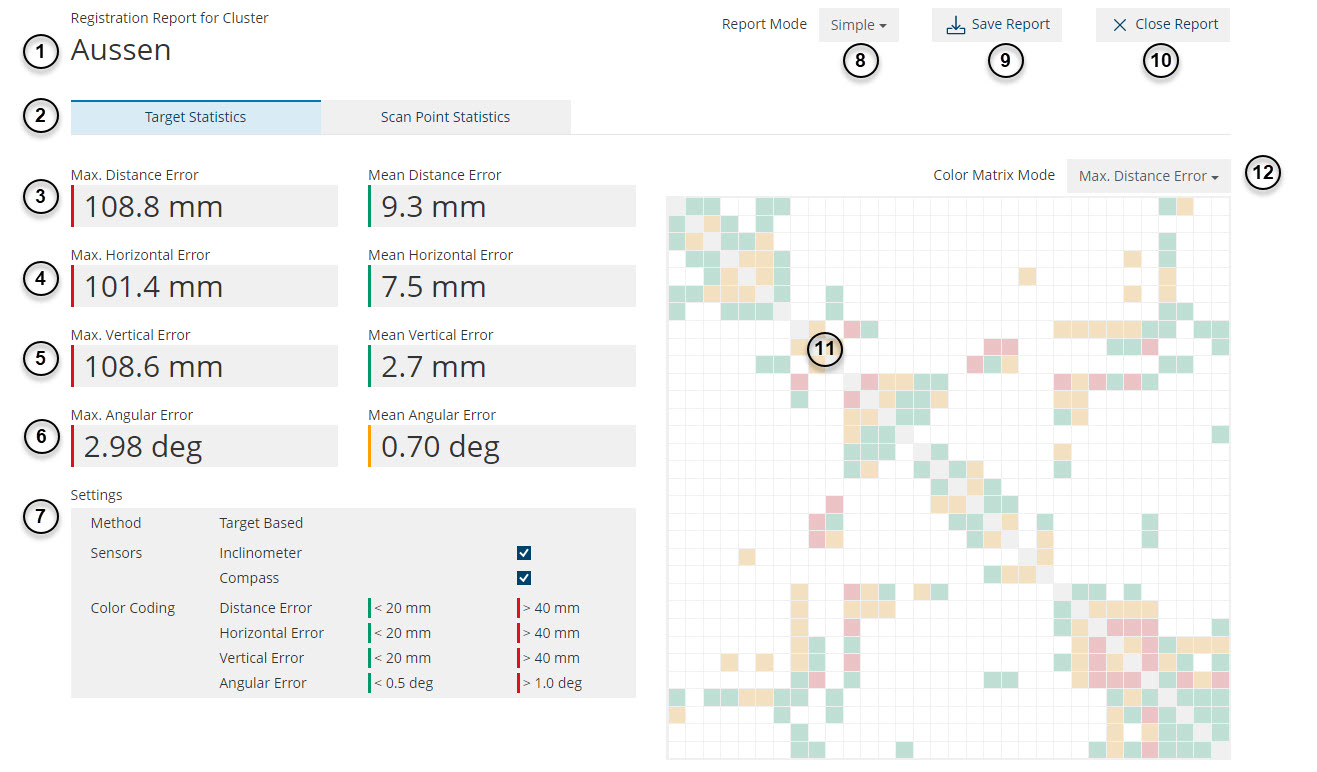
Figure 9-27 Target-based registration report
-
Name of the cluster
The name of the registered cluster the report is opened on. -
Switch between Target Statistics andScan Point Statistics.
-
Maximum Distance Error
This setting as well as the following statistics display the averaged Maximum and Mean error between all targets in this cluster: Maximum Distance Error / Mean Distance Error -
Maximum Horizontal Error / Mean Horizontal Error
-
Maximum Vertical Error / Mean Vertical Error
-
Maximum Angular Error / Mean Angular Error
Shows the averaged maximum or minimum angular error between all plane targets in this cluster.
Angular errors can only be calculated for plane targets, which are planes, checkerboards, and slabs. -
Settings
Shows the settings used for placing the scans as well as a legend for the color coding of errors. -
Report Mode
The report has three modes:
Simple: Displays all statistics between the first-level scans of the cluster.
Full: Displays all statistics between all scans inside the cluster (recursive).
Color Matrix Mode -
If you require the Registration Report Table for usage outside SCENE, you can either save the report as PDF or copy the report directly into Microsoft Excel. Mark the table, or parts of it, and copy it to Microsoft Excel. Save the Registration Report as PDF.
-
Click the Close button to close the Scan Report and to return to the Registration Dashboard.
-
Matrix
Gives a colored overview for the registration quality of the scans. Displays the error between a pair of scans or cluster. The type of error shown (e.g., Max Distance Error) can be changed in the Error Type Selection List. -
Error Type Selection List
Open the dropdown menu to select the type of error you want to see in the corresponding mode.
The view of the matrix depends on the content of the selected cluster. If this cluster contains subordinate clusters, the matrix displays the registration quality for those clusters. If the selected cluster contains scans, the matrix displays the registration quality for those scans.
If there is a square in yellow, red, or green color and you want to know which pair of scans or clusters they represent, use the mouse to hover over the square. The names of the two scans or clusters are displayed, with the error value.
The Detailed Errors table shows errors between corresponding targets in a structured way:
-
In the first level, the registered scans or clusters are listed. The maximum and mean errors for all the connections of the scans or clusters in the first level are displayed.
-
In the second level, the scans or clusters with which the scan or cluster of the first level has targets in common, are listed. The maximum and mean errors for each connected scan pair are displayed.
-
In the third level, individual targets and the errors in the registration of corresponding targets between the scans of the first and second level are listed. The point errors are displayed for each connected target pair.
Inclinometer Mismatches
The Inclinometer mismatches list is shown as part of the scan point statistics. This list displays the angular offsets between a scan's up direction after registration and the scan's up direction according to the scanner's inclinometer.
For scans without an inclinometer, a dash ‘-‘ is shown instead of a value.
Scan names are specified as follows:
-
Scan Name: For direct Scans of the main report cluster.
-
Cluster Name: For sub-clusters.
-
Cluster Name_Scan Name: For scans in the sub-clusters of the report cluster.
Scan Point Statistics
A similar report is available for the scan point statistics. However, this report shows the scan point references rather than the target pair references.
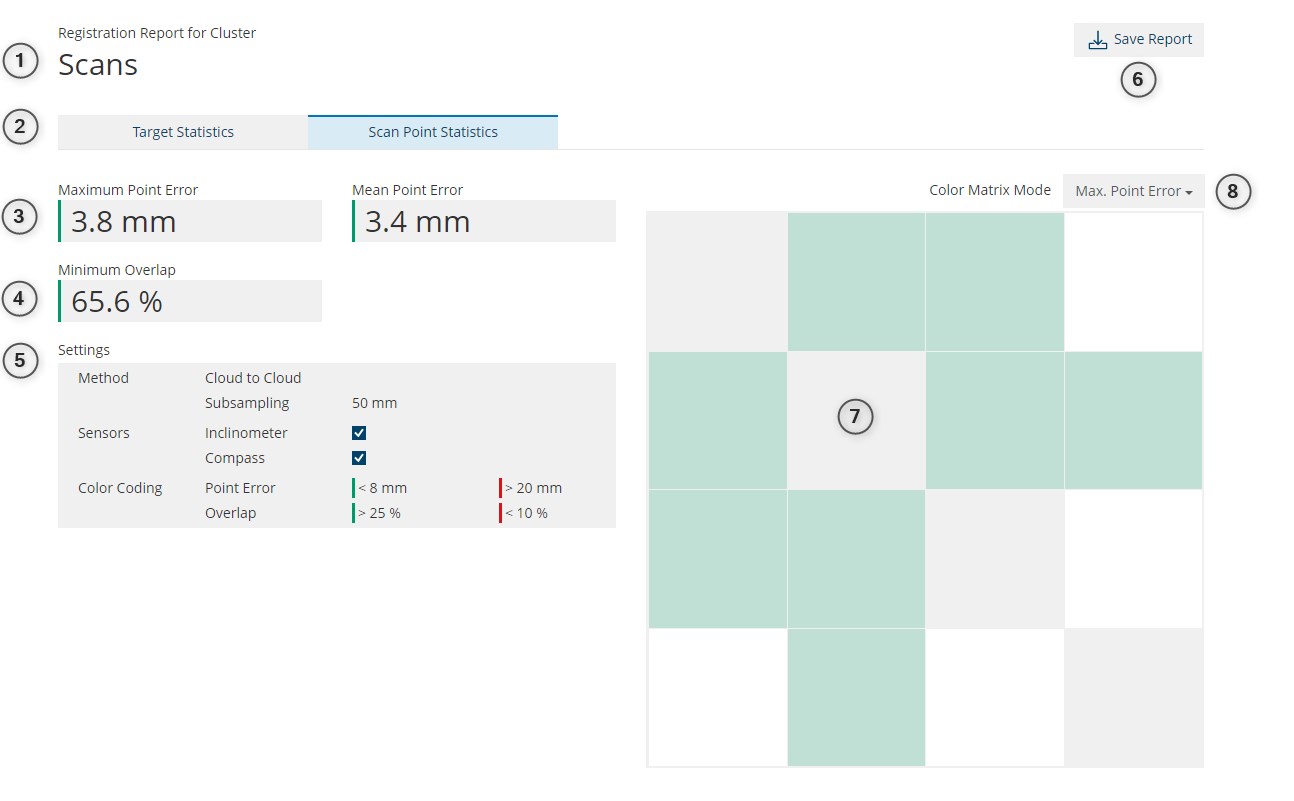
Figure 9-28 Scan point based registration report
-
Name of the cluster
The name of the registered cluster the report is opened on. -
Switch between Target Statistics and Scan Point Statistics.
-
Maximum Point Error
Maximum point error of all shown scan pairs.
Mean Point Error: Mean point error of all shown scan pairs. -
Minimum Overlap
Minimum percentage overlap of all shown scan pairs. All values are color coded with a bar on the left side, same as the table cells. -
Settings
Displays the settings used to register the selected cluster. -
If you require the Registration Report Table for usage outside SCENE, you can either save the report as PDF or copy the report directly into Microsoft Excel. Mark the table, or parts of it, and copy it to Microsoft Excel as PDF.
-
Color Matrix Mode
-
Error Type Selection List
Detailed Errors, Scan Point Statistics
The Detailed Errors table (in Simple Mode) shows detailed error values for every registered scan pair or cluster pair:
-
Depending on the selected report mode, in the first hierarchy, all scans inside the cluster are shown. The errors that are displayed are applicable to all connections of the Scan or Cluster.
-
The first hierarchy will show the name of the scan or cluster, the number of connections it has, the mean point error, maximum point error and minimum overlap.
-
By clicking on the first hierarchy row, the connections show the individual scan or cluster Name, point error, and overlap.
-
The three right columns are color coded with red, orange and green according to specific thresholds that can be adjusted using the registration settings.
The table can be sorted by clicking on the table header of every column.
Saving or Exporting the Registration Report
If you want to use the Registration Report Table outside SCENE, you can either save the report as PDF or copy the report directly into Microsoft Excel. Mark the table, or parts of it, and copy it to Microsoft Excel.
When importing the table to Excel, the decimal separator must correspond to the decimal separator used in SCENE. Otherwise, the numbers will be automatically converted into another format, e.g., a date.
Clicking the Save Report button opens a File Open dialog where a location and a file name can be chosen.
In the PDF report, the same data is displayed as in the SCENE report. Additionally, some information about the project are listed like project name and recording period.