 CDT (Coordinate Data Table)
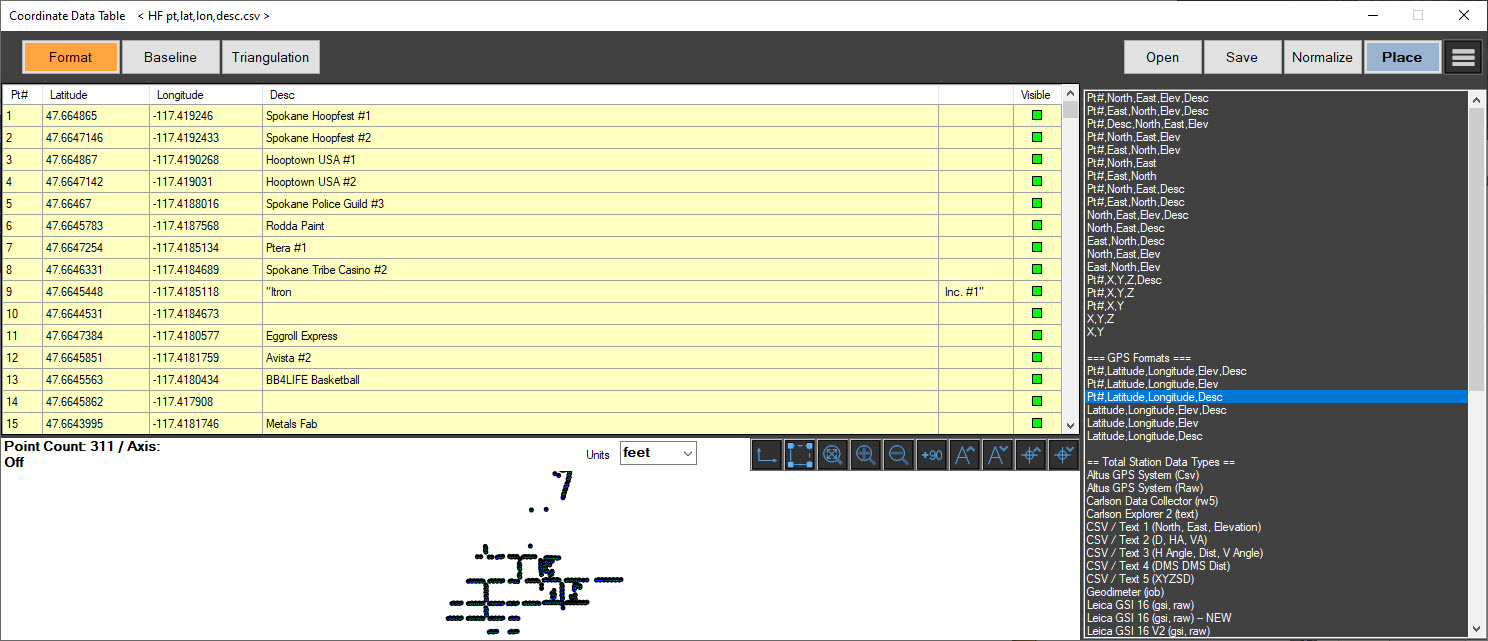
Use Coordinate Data Table (CD) to import measurements as points into your drawing. The Coordinate Data Table converts real-world measurement data into points, lines, and point labels that you can place into the drawing.
You can collect measurement data from laser total stations and export it in ASCII format which you can import in the Coordinate Data Table. You can also enter the data manually.
To use the Coordinate Data Table:
-
Open the Coordinate Data Table in one of the following ways:
-
Type the two-letter shortcut command, CD.
-
Select CDT from the Start Page.
-
Select CDT from the Home tab.
-
-
Select one of the Coordinate Data Table Modes.
-
Enter the data, or import the data by selecting Open and then selecting the ASCII data file.
- Click Normalize to move the group of points closer the origin. Use this option when total station data was collected with highly-varying degrees of offsets.
-
Use Menu options to perform other actions:
-
Print Report: Opens the Print Preview window.
-
Normalize Points: Moves the reference (axis/origin) to the first point. This option is helpful when total station data was collected with an extreme user set offset.
-
Open FARO SCENE DXF: - Opens a FARO SCENE DXF.
-
Import DWG/DWF Points: - Import a DXF file into the CDT (Coordinate Data Table) and add labels and geometry to separate layers. You can show or hide point numbers, descriptions, and line work, and edit global label text sizes.
-
Select <> Points - Select all of the points in the list.
-
Point Selector by Description - Select all points or points that include descriptions.
-
Show|Hide Selected Points - Show or hide the selected points.
-
Show|Hide All Points - Show or hide all of the points.
-
Clear Points - Clear all of the selected points.
- The X,Y axis relative to the point data displays with point data and line work. Use the following tools to make necessary adjustments in the drawing area.
- Click Save to save the updates to your data file. If you save the data in the baseline or triangulation formats, the software switches to the correct mode (baseline or triangulation) when the file is re-opened in the table.
- Click Place to place the data into the drawing.
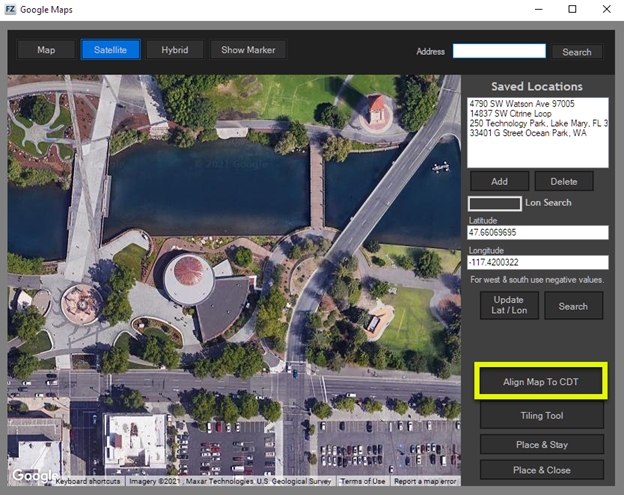
- To align the data to a map, open the Google map from Home > Satellite, and click Align Map to CDT.
When you are in Format mode, make sure that you select the correct data format before you import the data.
 Show Axis Show Axis |
Display the axis and the 0.0 reference point. |
 CDT Auto Line Work CDT Auto Line Work |
Automatically connect lines between points with common descriptions. You can modify lines after they are placed in the diagram, and are independent of the point data. |
 Zoom all Zoom all |
Zoom all of the points. |
 Zoom in/ Zoom out Zoom in/ Zoom out |
Zoom in or out on the area in the center of the drawing area. |
 Plus 90 Plus 90 |
Rotate the points 90 degrees. |
 Grow Text/Shrink Text Grow Text/Shrink Text |
Increase or decrease the size of the point label text. |
 Increase/Decrease Point Size Increase/Decrease Point Size |
Increase or decrease the sizes of all of the points. |
Coordinate Data Table Modes
Select the mode that best represents your data.
Format Mode
Select the type of data from the list on the right. Notice that the columns change according to the type of data format that you select. If you have the data in an ASCII file, select Open to import it.
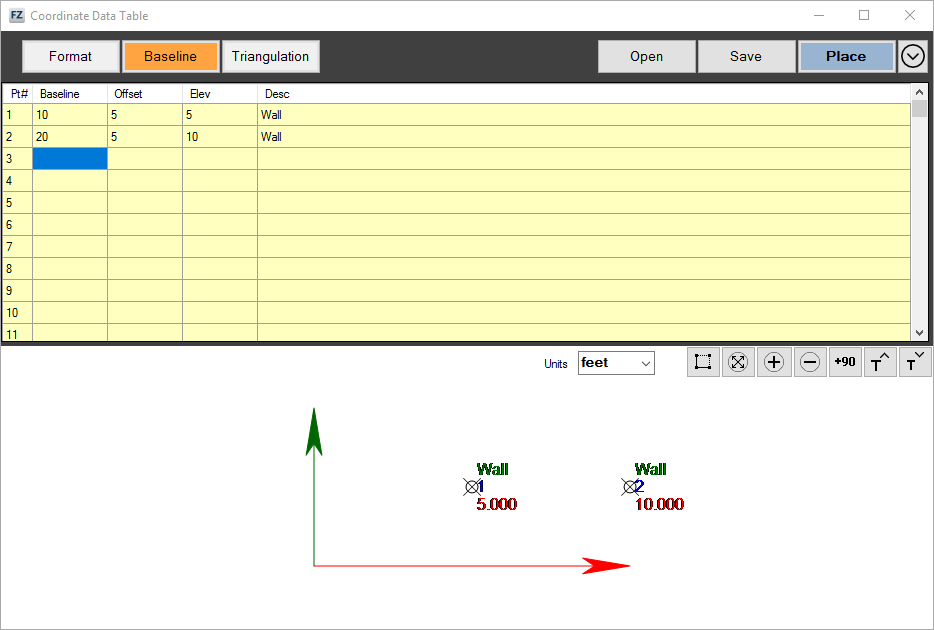
Baseline Mode
Add measurements by entering distance values. For example, you can enter values for a wall, along with an offset such as a perpendicular measurement to the wall.
Triangulation Mode
Create triangulation measurements by entering distances from two control points. The intersection between the distances is the location of the point.
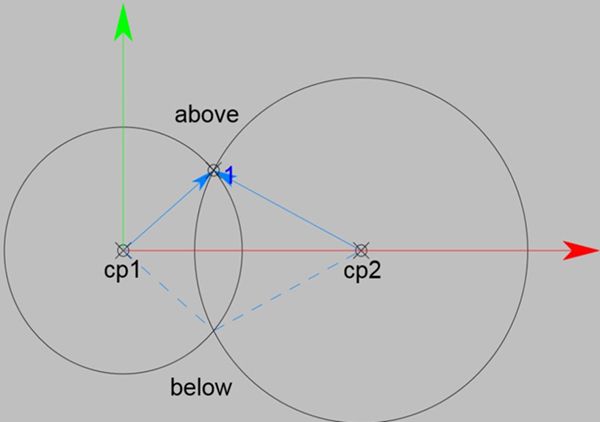
For example, if you draw circles from two control points and the distance is the circle radius. The two circles, one from each control point, will intersect at two points. Pick the correct point - above or below the line - that is located between the control points.
Enter data for the following fields:
| Dist 1 |
Distance from control point 1. This distance must be long enough to intersect with the distance from control point 2. |
| Dist 2 |
Distance from control point 2. This distance must be long enough to intersect with the distance from control point 1. |
| Above/Below |
You can enter elevation values for positive or negative Z elevations. Elevation data is optional. |
| Elevation |
You can enter values for positive or negative Z elevations. Elevation data is optional. |
| Description |
You can enter descriptions for points. Duplicate descriptions can be connected with the Automatic Line Work command. Descriptions are optional. |
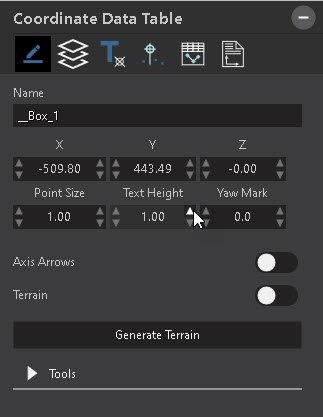
Coordinate Data Table Tool Panel
After you place the data in the drawing and select the data (axis), the Coordinate Data Table tool panel displays.
| Color panel | Opens the color pallet for color selection. Choose basic colors, or click Define Customer Colors to create colors. |
| Layer panel |
Assign the data to a layer. Options are: Layers dropdown Choose one of the following: Point Log - Select to use a point log. Road Layer - Select to use a road layer. |
| Display Style |
Opens the Text panel, which includes the following options: Color Pallet - Opens the color pallet for color selection. Back - Click to return to the Home panel. Point Style - Select the style of the displayed point. Size, Height and Length Values - Use direct entry or the dial arrows to change values for point size, text height, axis length and height. Point Label Display - Choose to display Description, Point Numbers, and Point Elevation. Select individual label color. You can tilt the text at a 45-degree angle. |
| Virtual Survey Mode | Opens Virtual Survey Mode to plane individual points. |
| Open Coordinate Data Table | Re-opens the Coordinate Data Table. |
| Report | Opens the Print dialog which allows you to create and print reports. |
| Name | Displays the name of the Coordinate Data Table. You can edit the name. |
| X, Y, Z Values |
Displays X, Y, Z values, which you can change by entering values or by using the dial arrows. |
| Point Size |
Sets the point size displayed in the diagram. |
| Text Height |
Sets the text height displayed in the diagram. |
| Rotation |
Sets the rotation of the axis and the data in the diagram. This can also be done using the dial arrows of the selected data. |
| Axis Arrows |
Display or hide arrow heads. |
| Terrain |
Allow the axis to adapt to the terrain. Press Generate Terrain to add terrain to the points. |
| Tools |
Expand Tools to access the following: Merge CDT - Merge two coordinate tables from a scene. The software interpolates common points to align the data. This functionality is commonly-used for accident reconstruction. Normalize Points - Move the points closer to the origin. Display Style - Adjust the display options for the points included in the CDT. Virtual Survey Mode - Opens Virtual Survey Mode. Open Coordinate Data Table - Re-opens the Coordinate Data Table. Report - Opens the print dialog that contains information about the CDT report. |
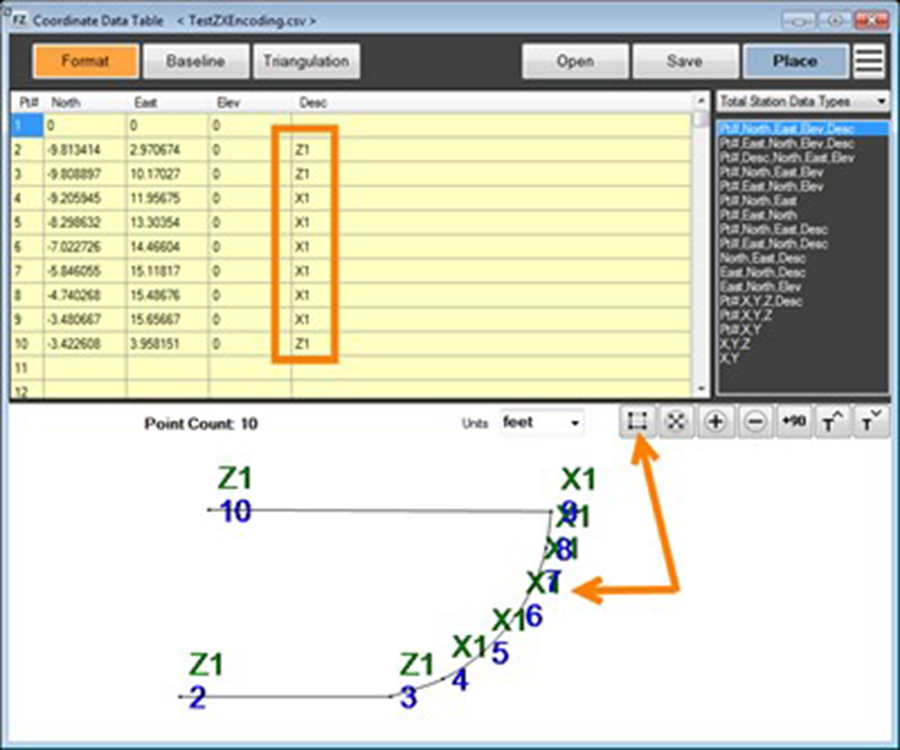
ZX Encoding
ZX encoding is enabled in the CDT tool when you add line work to an imported coordinate data file with ZX encoding.
-
Open or import a coordinate data file with ZX encoding.
-
Click the Line-Work command. Lines, continuous lines, and curves are created automatically, based on the coded points.
-
Click Place to insert the data into the scene.
