 Survey
Just as you might use a total station in the real-world, Survey allows you to take a point-by-point survey in the virtual world. You can adjust the points, and open the coordinate table to complete the survey.
 Virtual Survey
The Virtual Survey tool is located on the Point Cloud tab and on the Power Tools tab.
To create one or more virtual surveys in the drawing:
-
Confirm that Point Cloud Snap is enabled, and click Survey on either the Point Cloud or Power Tools ribbon.
-
In the drawing, click the origin point of the coordinate system.
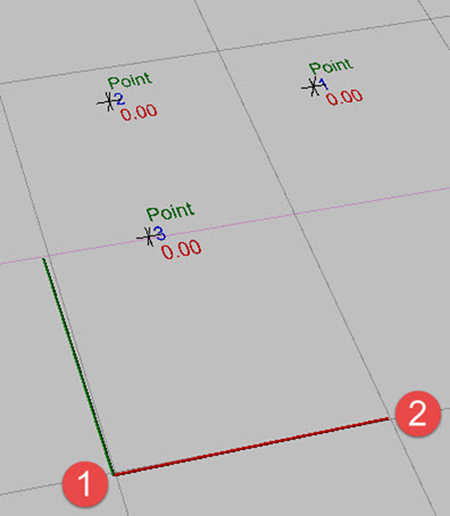
-
Hover the cursor to reorient the Rotation point (2) into place and click the desired set point.
-
Snap the survey points as desired.
-
Use the grips on the coordinate system to move or rotate the system and all points in the set.
-
Name the first set of points in the New Description field.
-
Click the desired points. Notice that a Delta Z label is shown with each point showing the difference in elevation from the last point. This can help identify if the point did not snap to the cloud.
-
Enter a new name into the New Description field and click the new points.
-
Repeat until all point sets are complete.
-
Double-click to end survey point collection.
-
In the Virtual Survey tool panel, click Show CDT Form (1) to reopen the Coordinate Data Table or Reposition Baseline to complete reset the coordinate system.
Modifying the Survey Points
You can adjust points with the grips or the Coordinate Data Table tool panel. The following options are available in the Coordinate Data Table tool panel.
| Color | Change the color of the point markers. |
| Layer | Change the layer of the survey points. |
| Display Style | Change the style of all aspects of the points. |
| Survey Mode | Start point taking mode. |
| Coordinate Data Table | Open the Coordinate Data Table. |
| X,Y,X | Adjust the individual coordinates of the point set. |
| Point Size | Adjust the point size of the point set. |
| Text Height | Change the size of the label font. |
| Rotation | Rotate the point set by degrees. |
| Axis Arrows | Turn off and on axis arrows. |
| Generate Terrain/Terrain Missing | When aligning a satellite image to Coordinate Data Table points containing Z value, Generate Terrain will align the image to the points. If no such points are available, Terrain Missing displays. |
The Coordinate Data Table
Use the Coordinate Data Table, to format or connect a point set, or print a report.
Options in the Coordinate Data Table dialog are as follows:
| Format | CDT that allows multiple format options. |
| Baseline | A basic CDT. |
| Triangulation | A CDT that allows triangulation. |
| Open | Browse to and open a coordinate file. |
| Save | Saves changes to the CDT. |
| Place | Click to insert the CDT after style changes are made. |
| Report | Opens the print reports window. |
| Drop-Down Menu |
Print Report Click to print the CDT. Open SCENE DXF Click to open a SCENE DXF. Normalize Points Moves the reference (axis/origin) to the first point. Use for cases where total station data was collected using an extreme user set offset. |
| Coordinate Data Table | Point layout. |
| Total Station Data Types | A drop-down menu for selecting the data collection method used. |
| Data Table Style | Styles for display the Coordinate Data Table. |
| Units | Modify the measurement units for the chart and points. |
| Auto Line Work | Connect each point set with lines. |
| Zoom | Zoom All, Zoom In, and Zoom Out. |
| +90 | Flip the coordinates 90-degrees. |
| Text Size | Change the size of the label font. |
