Temperature
|
1238888 |
The Temperature group controls is a set of commands for checking your
Temperature Graph
Click Temperature Graph to view the recorded temperature of the
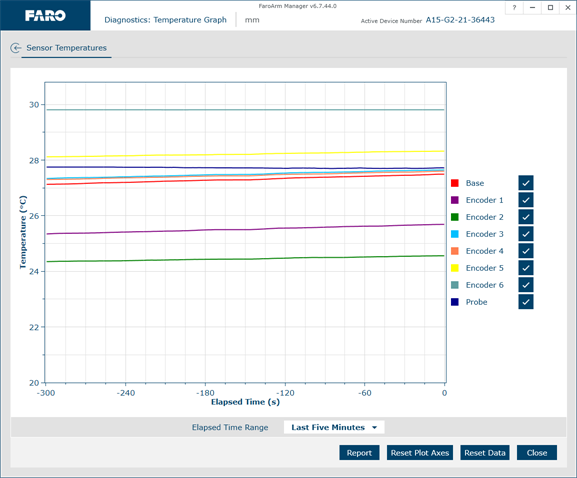
Temperature Graph dialog box
Rotate the mouse wheel to zoom in and out of the chart. Right-click and drag to move the chart around the window.
-
Click Reset Plot Axes or double-click the wheel button to reset the chart view.
-
Click on any line to see the details.
-
Choose a time range from the Elapsed Time Range drop-down list.
-
Clear the Encoder check box to remove it from the chart.
-
Click Report to generate a report file (*.csv) of the chart.
-
Click Reset Data to clear all temperate data and restart the temperature measurement.
Temperature Stability
Click Temperature Graph to view the ambient temperature change of the
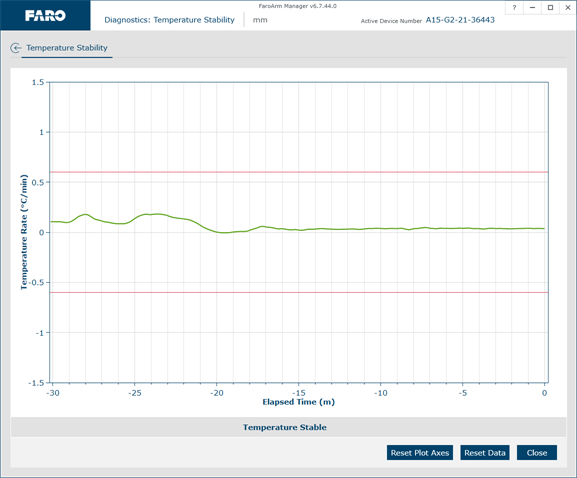
Temperature Stability dialog box
-
Rotate the mouse wheel to zoom in and out of the chart. Right-click and drag to move the chart around the window. Double-click the wheel button to reset the chart view.
-
Click Reset Plot Axes or double-click the wheel button to reset the chart view.
-
Click on the line to see the details.
-
Click Reset Data to clear all temperate data and restart the temperature measurement.
Notice the ambient temperature for the
