Temperature
|
1238888 |
The Temperature group controls is a set of commands for checking your
Temperature Graph
Click Temperature Graph to view the recorded temperature of the
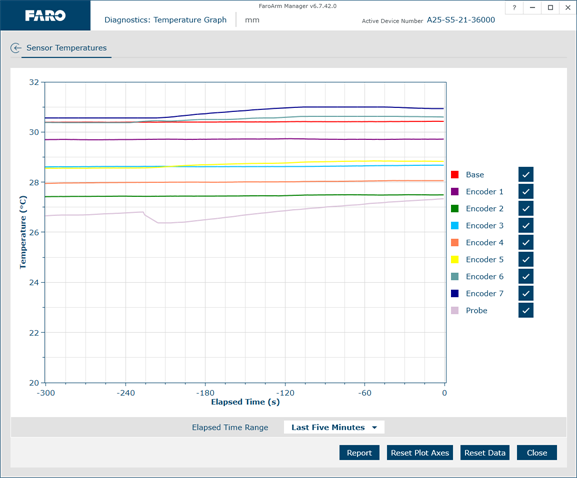
Figure 3-53 Temperature Graph dialog box
Rotate the mouse wheel to zoom in and out of the chart. Right-click and drag to move the chart around the window.
-
Click Reset Plot Axes or double-click the wheel button to reset the chart view.
-
Click on any line to see the details.
-
Choose a time range from the Elapsed Time Range drop-down list.
-
Clear the Encoder check box to remove it from the chart.
-
Click Report to generate a report file (*.csv) of the chart.
-
Click Reset Data to clear all temperate data and restart the temperature measurement.
Temperature Stability
Click Temperature Graph to view the ambient temperature change of the
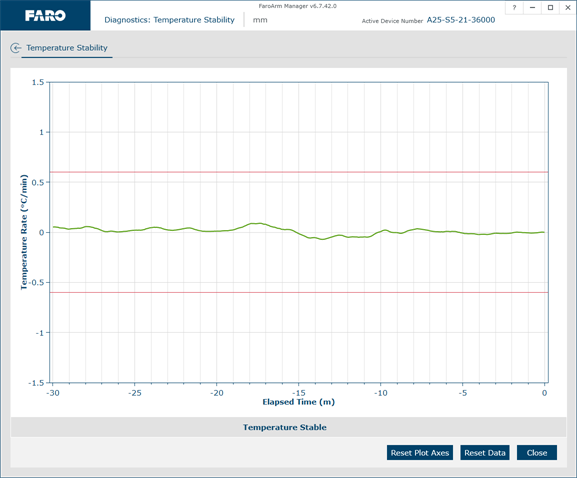
Figure 3-54 Temperature Stability dialog box
-
Rotate the mouse wheel to zoom in and out of the chart. Right-click and drag to move the chart around the window. Double-click the wheel button to reset the chart view.
-
Click Reset Plot Axes or double-click the wheel button to reset the chart view.
-
Click on the line to see the details.
-
Click Reset Data to clear all temperate data and restart the temperature measurement.
Notice the ambient temperature for the
