Analytics: Groups Tab
|
1238888 |
On this page, you can see which region or division leverages Sphere XG the most. This is helpful for internal billing and adoption tracking.
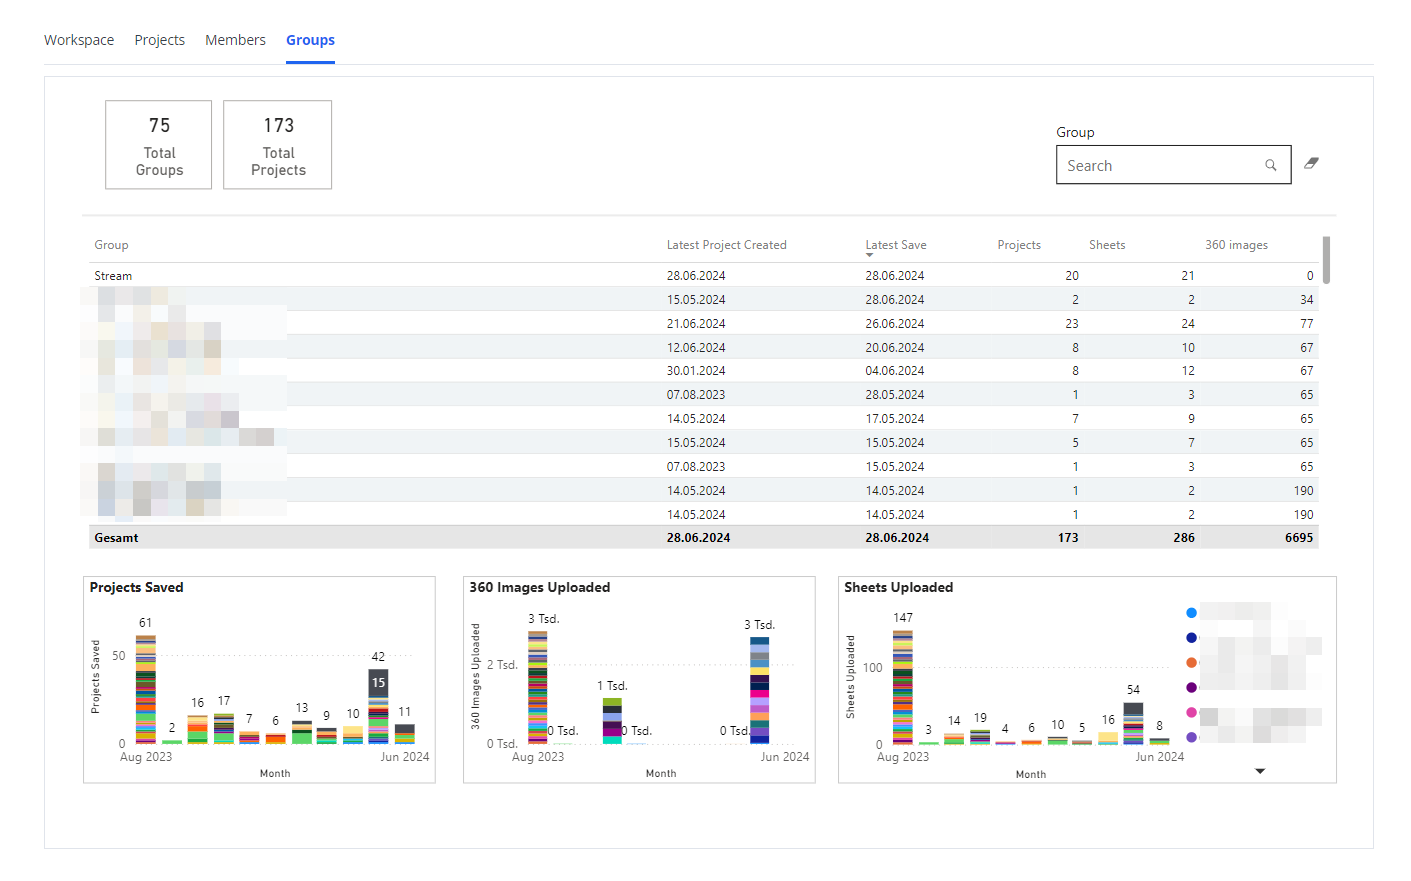
Figure 1-31 Analytics, Groups tab
Group Numbers
Shows the total number of groups in this workspace.
Search Options
You can search according to the group name.
Group List
List showing the following properties per group:
-
Group name
-
Date when the latest project was created
-
Latest saving date of a project
-
Number of projects that belong to the group
-
Number of sheets in projects belonging to the group
-
Number of 360° photos in projects belonging to the group
Group Charts
The following charts are available. More charts may be added. The chart content changes based on the line you have selected in the list.
